


Knowledge Required: Medium understanding of KQL concepts
Tools required: Microsoft Sentinel, Defender for Endpoint
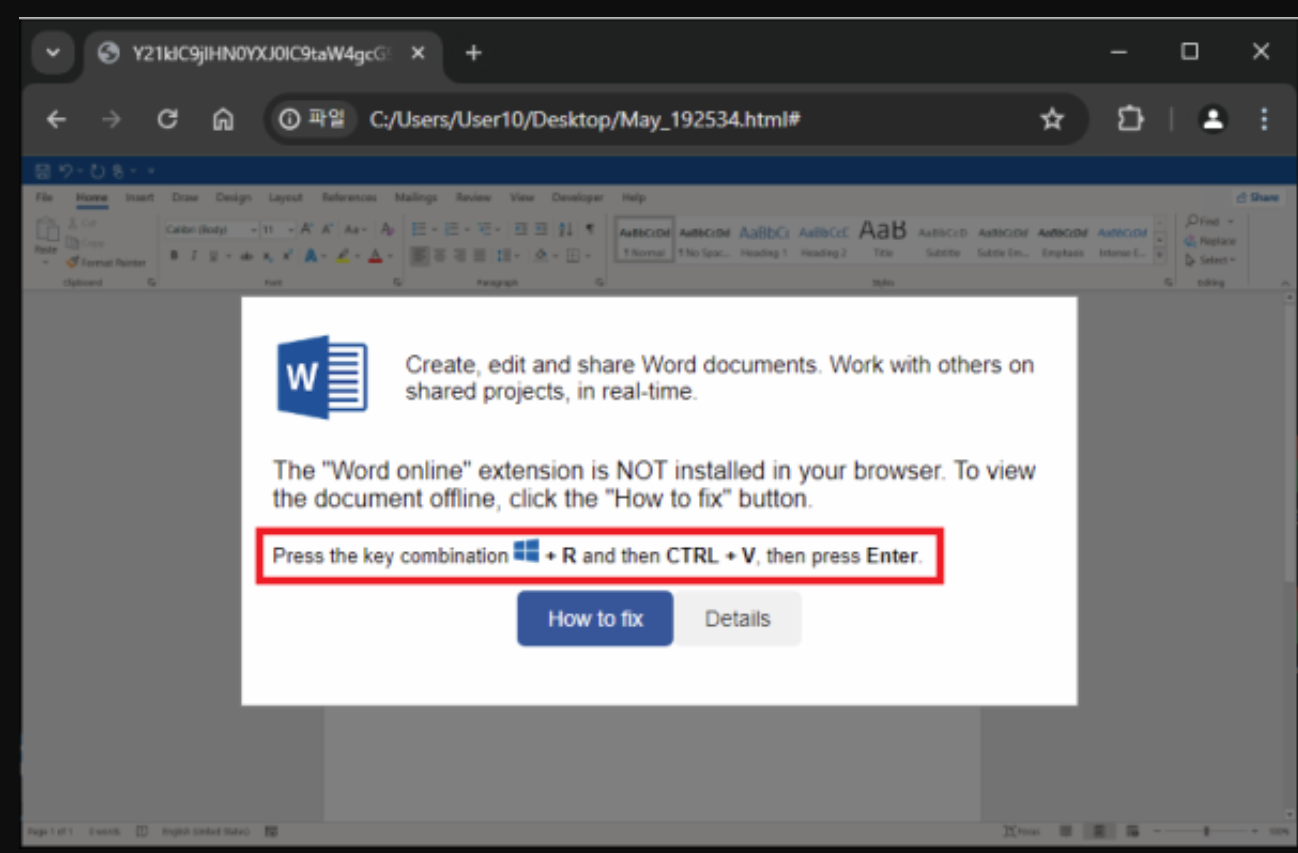
Paste and run malware slowly started gaining prevalence towards the end of 2024. It often convinces users to use the ‘Run’ prompt (Windows + R) key and copies a malicious command to the clipboard for them to paste and run. It’s a simple; easy to distribute via multiple methods and with the rise of generative A.I, unchallenging to generate something that looks convincing:
We’re going to write a KQL query to detect this. Skip to the bottom of this article if you want the full query, or keep reading to see how we use a nifty registry key to detect this.
The RunMRU registry key
I recently came across an article that highlighted how each user has a ‘MRU’ registry key. Every time a user makes use of the ‘Run’ prompt, this key gets updated with a history of what they’ve run. There’s a great post about it here: Run MRU Blog.
Test the theory
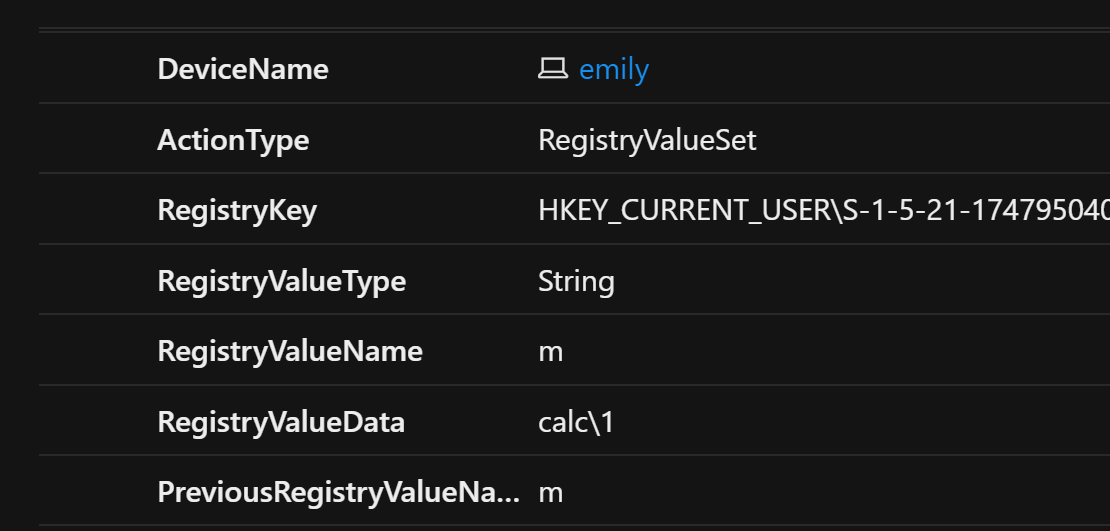
We can test this by spawning ‘calc’ from the run prompt and construct a simple query to look for Registry modifications:
DeviceRegistryEvents
| where RegistryKey has @"Software\Microsoft\Windows\CurrentVersion\Explorer\RunMRU"
 Great success!
So after playing about with this for a little while, I observed the following behaviour:
- The registry key data is not always conducive to what the user runs. Sometimes it’s a series of random characters. I suspect this is a database key that can be queried later by Windows.
- Even if Registry keys under this directory contain a random value, there always seems to be a registry modification whenever the ‘Run’ prompt is used. This allows it to be used as the foundation for our detection.
- Side note: the history of commands seems to be indexed in alphabetical order by a-z (with the above example being ’m’). I don’t know why this is not just indexed by a number.
Detecting Subsequent Behaviour
Most examples of ‘paste and run’ malware will use a built-in tool (powershell, cmd) to download further malicious files. Therefore, it makes sense for us to elevate our detection by looking for this registry modification followed by such activity. ‘DeviceProcessEvents’ will contain data that we can use to pick up on this.
We can look for logs submitted within the same time frame of each other with a process called time binning. On our initial table, we specify how ‘big’ our bin is with a time frame; think of this as adding a label to the bin.
We can then repeat this process on another table and if the ’label’ on the bin is the same, we can join those events together as also happening in the same time frame:
let SuspiciousFileName=dynamic(['powershell', 'cmd', 'script', 'ping']);
DeviceRegistryEvents
| where RegistryKey has @"Software\Microsoft\Windows\CurrentVersion\Explorer\RunMRU"
| summarize RegsitryReportId=make_set(ReportId), RegistryTimestamp=make_set(Timestamp) by DeviceId, InitiatingProcessAccountName, TimeBin=bin(Timestamp, 2m)
| join (DeviceProcessEvents
    | where FileName has_any(SuspiciousFileName)
    | where InitiatingProcessFileName == @"explorer.exe"
    | summarize ProcessReportId=make_set(ReportId), ProcessTimestamp=make_set(Timestamp) by DeviceId, InitiatingProcessAccountName, TimeBin=bin(Timestamp, 2m))
    on DeviceId, InitiatingProcessAccountName, TimeBin
I appreciate this is quite a jump in complexity. The above has now done the following:
- For each registry event that matches, we make a list of the time it happened (RegistryTimestamp) and an ID (RegsitryReportId) that we can link it back to . This gets put in a bin size of 2 minutes.
- We do a join, allowing us to query DeviceProcessEvents. We look for anything that has been spawned by explorer (the result of the ‘Run’ prompt) and anything where the filename has key suspicious phrases. This can be tailored to your needs!
- In DeviceProcessEvents, we do the same process of time binning, the join then happens on anything that’s happened in the same time bin (i.e. within a two minute window) and where the device and user match between the two tables.
This results in the following fields:
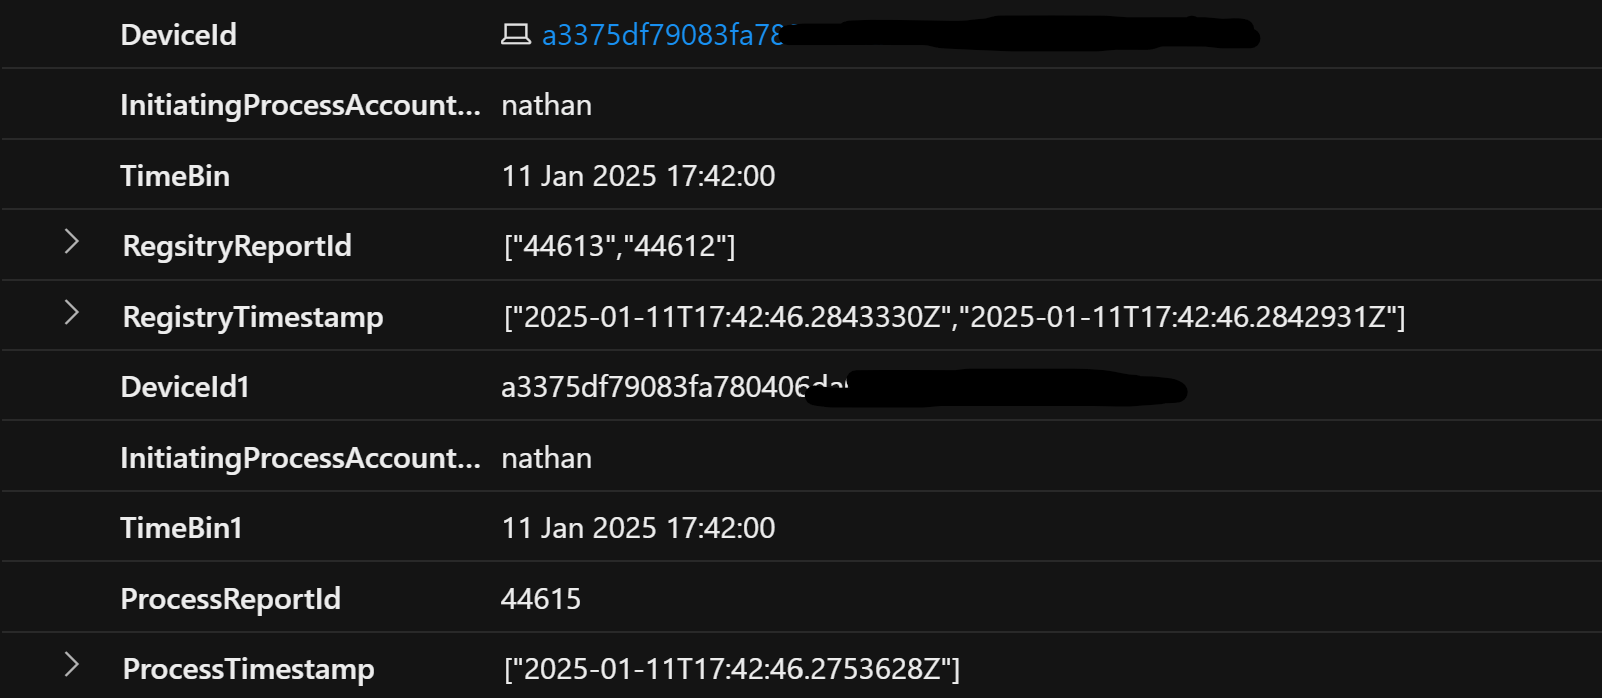 We now have a list of relevant timestamps and log ID’s from each table
Order matters!
We could just stop there if we liked. Our current results indicate a list of events from both tables that happened within a 2 minute time frame of each other. To more accurately detect our attack (and avoid false positives) we need to look for the registry activity first, followed by a process spawned after.
To do this, let’s start by using ‘mv-expand’. We can convert the list of Registry ReportIds and Timestamps so that each gets their own row (or their own log) similar to how they were before:
| mv-expand RegsitryReportId, RegistryTimestamp // mv-expand for each registry record
| extend RegistryReportId=tolong(RegsitryReportId), RegistryTimestamp=todatetime(RegistryTimestamp)
The ‘summarize’ converted these to a dynamic type, so we need to convert these back to their original data types with ’extend’.
We can now do the same for our DeviceProcessEvents logs. In doing a mv-expand, one after the other, it creates a new log for containing a single Registry timestamp and Process timestamp. This effectively gives us rows for every permutation of timestamps captured in the summarize statements:
| mv-expand  ProcessTimestamp, ProcessReportId
| extend ProcessReportId=tolong(ProcessReportId), ProcessTimestamp=todatetime(ProcessTimestamp)
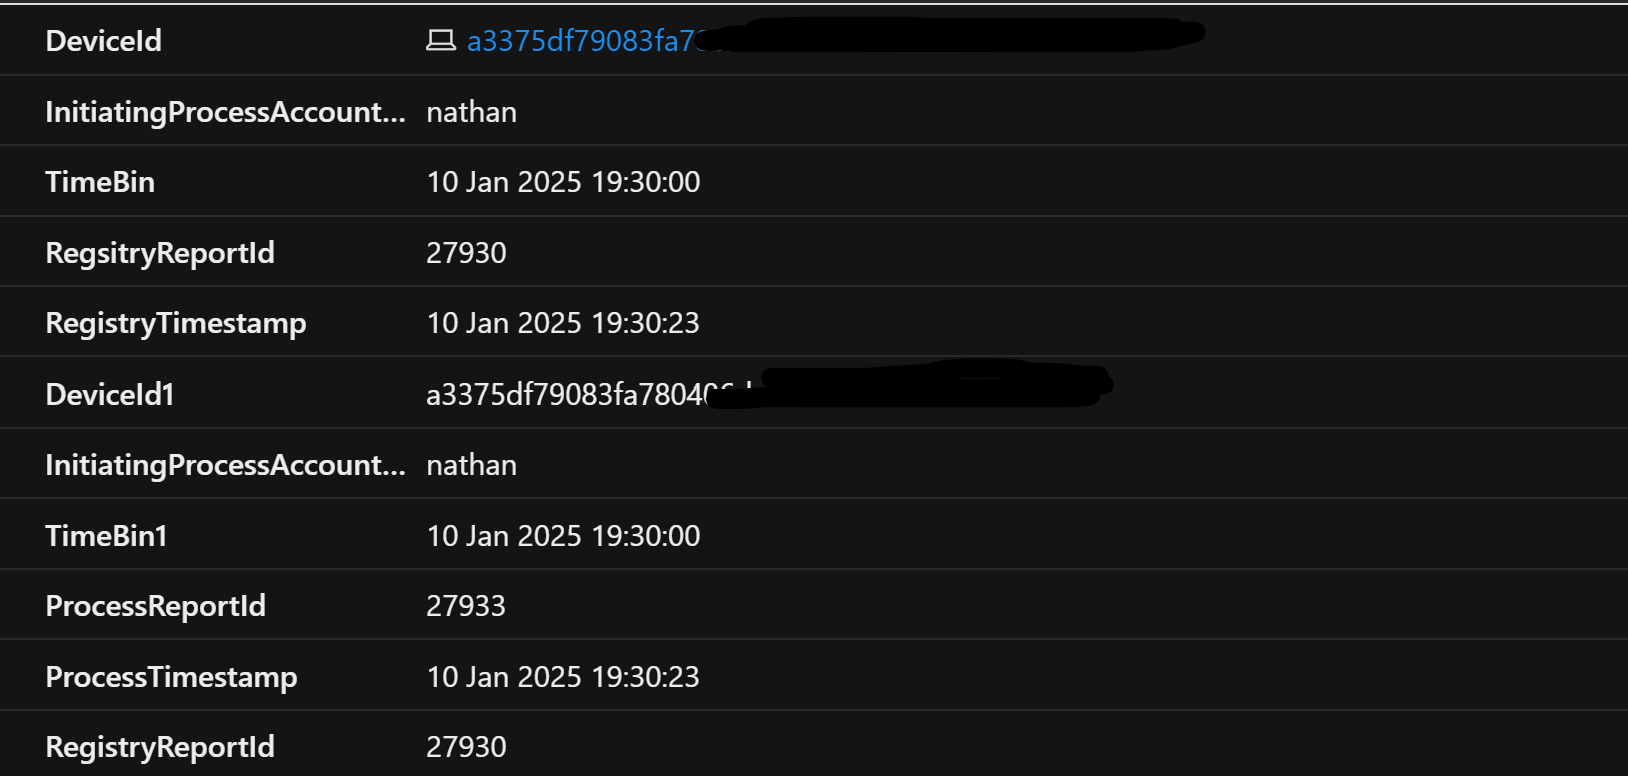 A sample result. No more events aggregated in a list, each has their own row (or log)
Evaluating the order of events For each row, we can create a new field that shows the time difference between the Registry timestamp and the Process timestamp:
| extend TimeDeltaSec=datetime_diff('second', RegistryTimestamp, ProcessTimestamp)
We can then look to see which event happened first, by seeing if the activity happened at the same time, or there is a positive number of seconds between, indicating the Process timestamp happened after:
| where TimeDeltaSec >= 0
Experienced KQL editors may ask why not use ‘TimeA > TimeB’ syntax instead of creating a new field? My testing actually showed this to be inconsistent. I hypothesize it’s because the the two timestamps can happen with milliseconds of each other and may not get evaluated at this granularity?
Adding our context back in
The query results are filtered to processes that have been created after the registry activity, but contain very little context into what these are, such as the process command line. This is seen in the earlier screenshot above.
We can use the ‘ReportId’ from each table to bring all original columns back in:
| join DeviceRegistryEvents on DeviceId, $left.RegistryReportId==$right.ReportId
| join DeviceProcessEvents on DeviceId, $left.ProcessReportId == $right.ReportId
Testing, Testing 1,2,3…
The logic can be tested by using the ‘Run’ prompt with something benign. In this case, we’ll use PowerShell to invoke a web request; something that would be typically used in downloading malware:
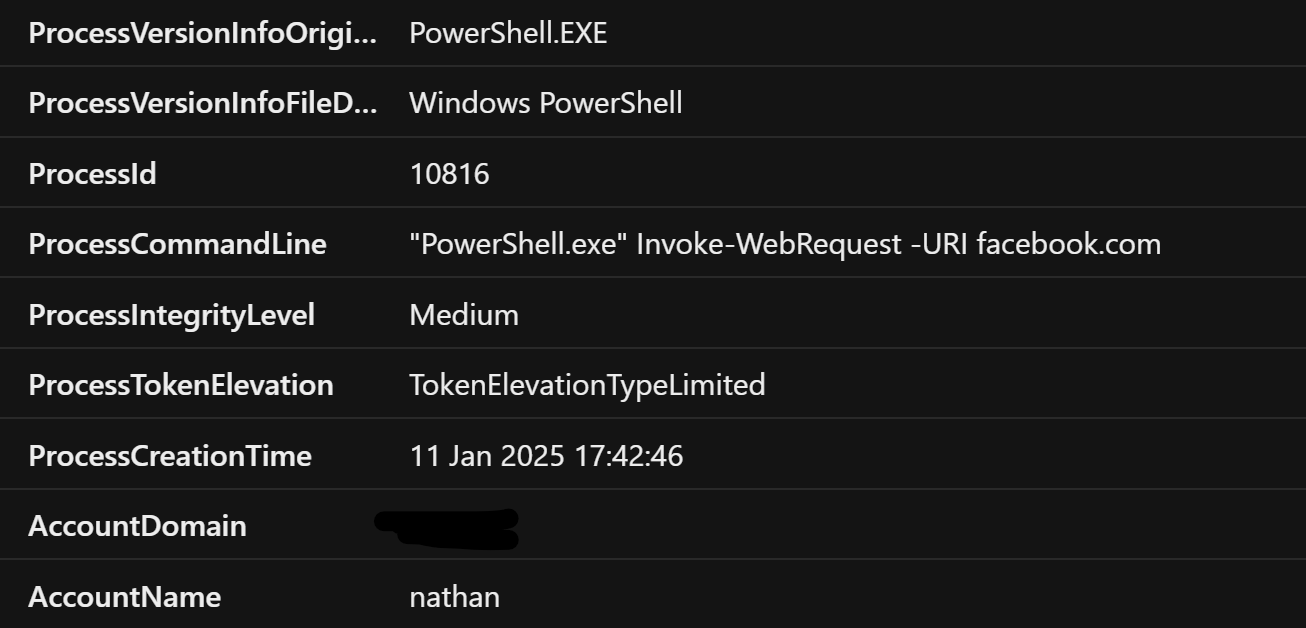 Perfect, it works!
Next steps Given the type of threat this detection highlights, this could be combined with other Defender XDR features such as triggering a device isolation, until somebody can manually confirm the device is safe. It’s always worth baselining and refining queries prior to introducing them to your environment as this will catch people that still make use of the ‘Run’ prompt for normal workflows.
Full Query
let SuspiciousFileName=dynamic(['powershell','cmd', 'script', 'ping']);
DeviceRegistryEvents
| where RegistryKey has @"Software\Microsoft\Windows\CurrentVersion\Explorer\RunMRU"
| summarize RegsitryReportId=make_set(ReportId), RegistryTimestamp=make_set(Timestamp) by DeviceId, InitiatingProcessAccountName, TimeBin=bin(Timestamp, 2m)
| join (DeviceProcessEvents | where FileName  has_any(SuspiciousFileName) | where InitiatingProcessFileName == @"explorer.exe" | summarize ProcessReportId=make_set(ReportId), ProcessTimestamp=make_set(Timestamp) by DeviceId, InitiatingProcessAccountName, TimeBin=bin(Timestamp, 2m)) on DeviceId, InitiatingProcessAccountName, TimeBin
| mv-expand RegsitryReportId, RegistryTimestamp // mv-expand for each registry record
| extend RegistryReportId=tolong(RegsitryReportId), RegistryTimestamp=todatetime(RegistryTimestamp)
| mv-expand  ProcessTimestamp, ProcessReportId
| extend ProcessReportId=tolong(ProcessReportId), ProcessTimestamp=todatetime(ProcessTimestamp)
| extend TimeDeltaSec=datetime_diff('second', RegistryTimestamp, ProcessTimestamp) // this brings the unit of measurement to something controlable. Can be nanoseconds between based on testing
| where TimeDeltaSec >= 0 // not negative, so did not happen beforehand
| join DeviceRegistryEvents on DeviceId, $left.RegistryReportId==$right.ReportId
| join DeviceProcessEvents on DeviceId, $left.ProcessReportId == $right.ReportId
EOF
